


It's surprising how this took longer than expected. My apologies. 🙏🏻
Now, let's get to the fun part.
In this part of "Folium - The answer to Geospatial Visualization" we would be utilizing folium's ability to create markers on the map based on the dataset.
We'd be using the San Francisco crime dataset I found on Kaggle.
Getting the necessities in place
- We import the required packages:
import numpy as np
import pandas as pd
import folium
- Next, we set up somethings that would be explained in a bit:
data = pd.read_csv('../input/Police_Department_Incidents_-_Previous_Year__2016_.csv')

limit = 100
df_incidents = data.iloc[0:limit, :]

latitude = 37.77
longitude = -122.42
Let's explain the code snippet above:
- In the first line of code we use pandas ".read_csv" method to read our dataset which is in .csv format and assign it to the "data" variable
- In the second line of code, we shrink our dataset to the first 100 rows and assign that to the df_incidents variable. We are doing this because there are exactly 150,500 rows of data in this dataset and that would need a huge computation power to represented on the map.
- In the third and fourth line of code, we are assigning the latitude and longitude of San Francisco to variables named latitude and longitude respectively.
- Now, the final part and we'd view the output
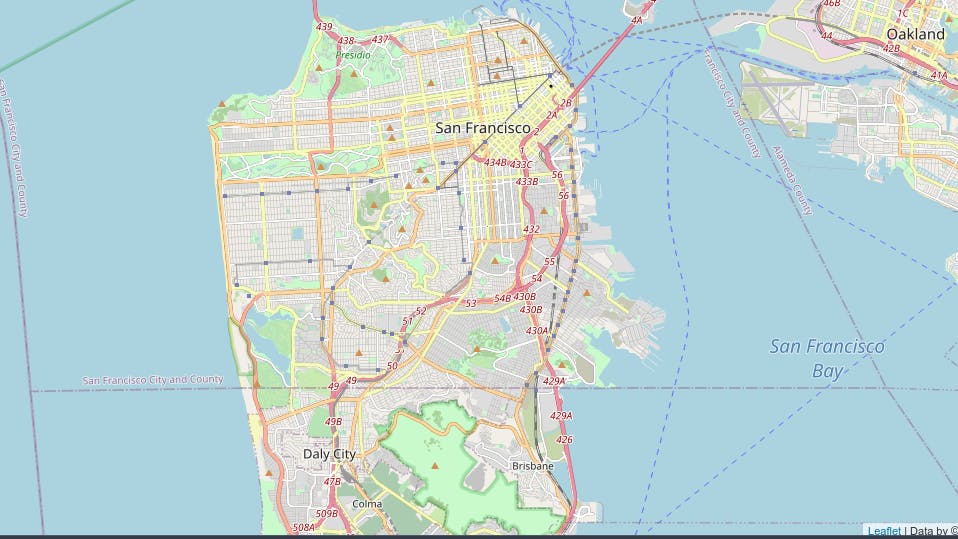
sanfran_map = folium.Map(location=[latitude, longitude], zoom_start=12)

sanfran_map
Below is the result of the code.
Set up markers for crimes
Now let's superimpose the locations of the crimes onto the map. The way to do that in Folium is to create a feature group with its own features and style and then add it to the sanfran_map.
We instantiate a feature group for the incidents in the data frame
incidents = folium.map.FeatureGroup()
Next, we loop through the 100 crimes and add each to the incidents feature group
for lat, lng, in zip(df_incidents.Y, df_incidents.X):
    incidents.add_child(
        folium.CircleMarker(
            [lat, lng],
            radius=5,
            color='yellow',
            fill=True,
            fill_color='blue',
            fill_opacity=0.6
        )
    )
Finally, we add incidents to map and run the code.
sanfran_map.add_child(incidents)
This would create a map with blue markers and yellow outlines that pinpoint the location of crimes from our dataset. Below is the output of the code.
It's nice, right? 😎 Now, let's make it better. We can add labels to it that allow you to click on any of the markers to see what kind of crime occurred there.
All we need to do is add the category (df_incidents.Category) column from the data frame, map it to a variable named "label" in our for loop, and then assign it to the "popup" attribute of folium.CircleMarker().
for lat, lng, label in zip(df_incidents.Y, df_incidents.X, df_incidents.Category):
    folium.CircleMarker(
        [lat, lng],
        radius=5,
        color='yellow',
        fill=True,
        popup=label,
        fill_color='blue',
        fill_opacity=0.6
    ).add_to(sanfran_map)

# show map
sanfran_map
The snippet above would create the output below.
From this, you can see that Folium really packs a bunch. This is just a glimpse of all folium has to offer, you can utilize it in a lot of ways and it's all left for you to decide.
Here is a link to the Kaggle notebook for part 1 and 2 of Folium - The answer to Geospatial Visualization. The notebook has 2 extra examples I hope you find them interesting. 🤓
Happy Coding!
Happy Hacking!
#staysafe!